Design Your Truth

Visualising emotional responses at TED
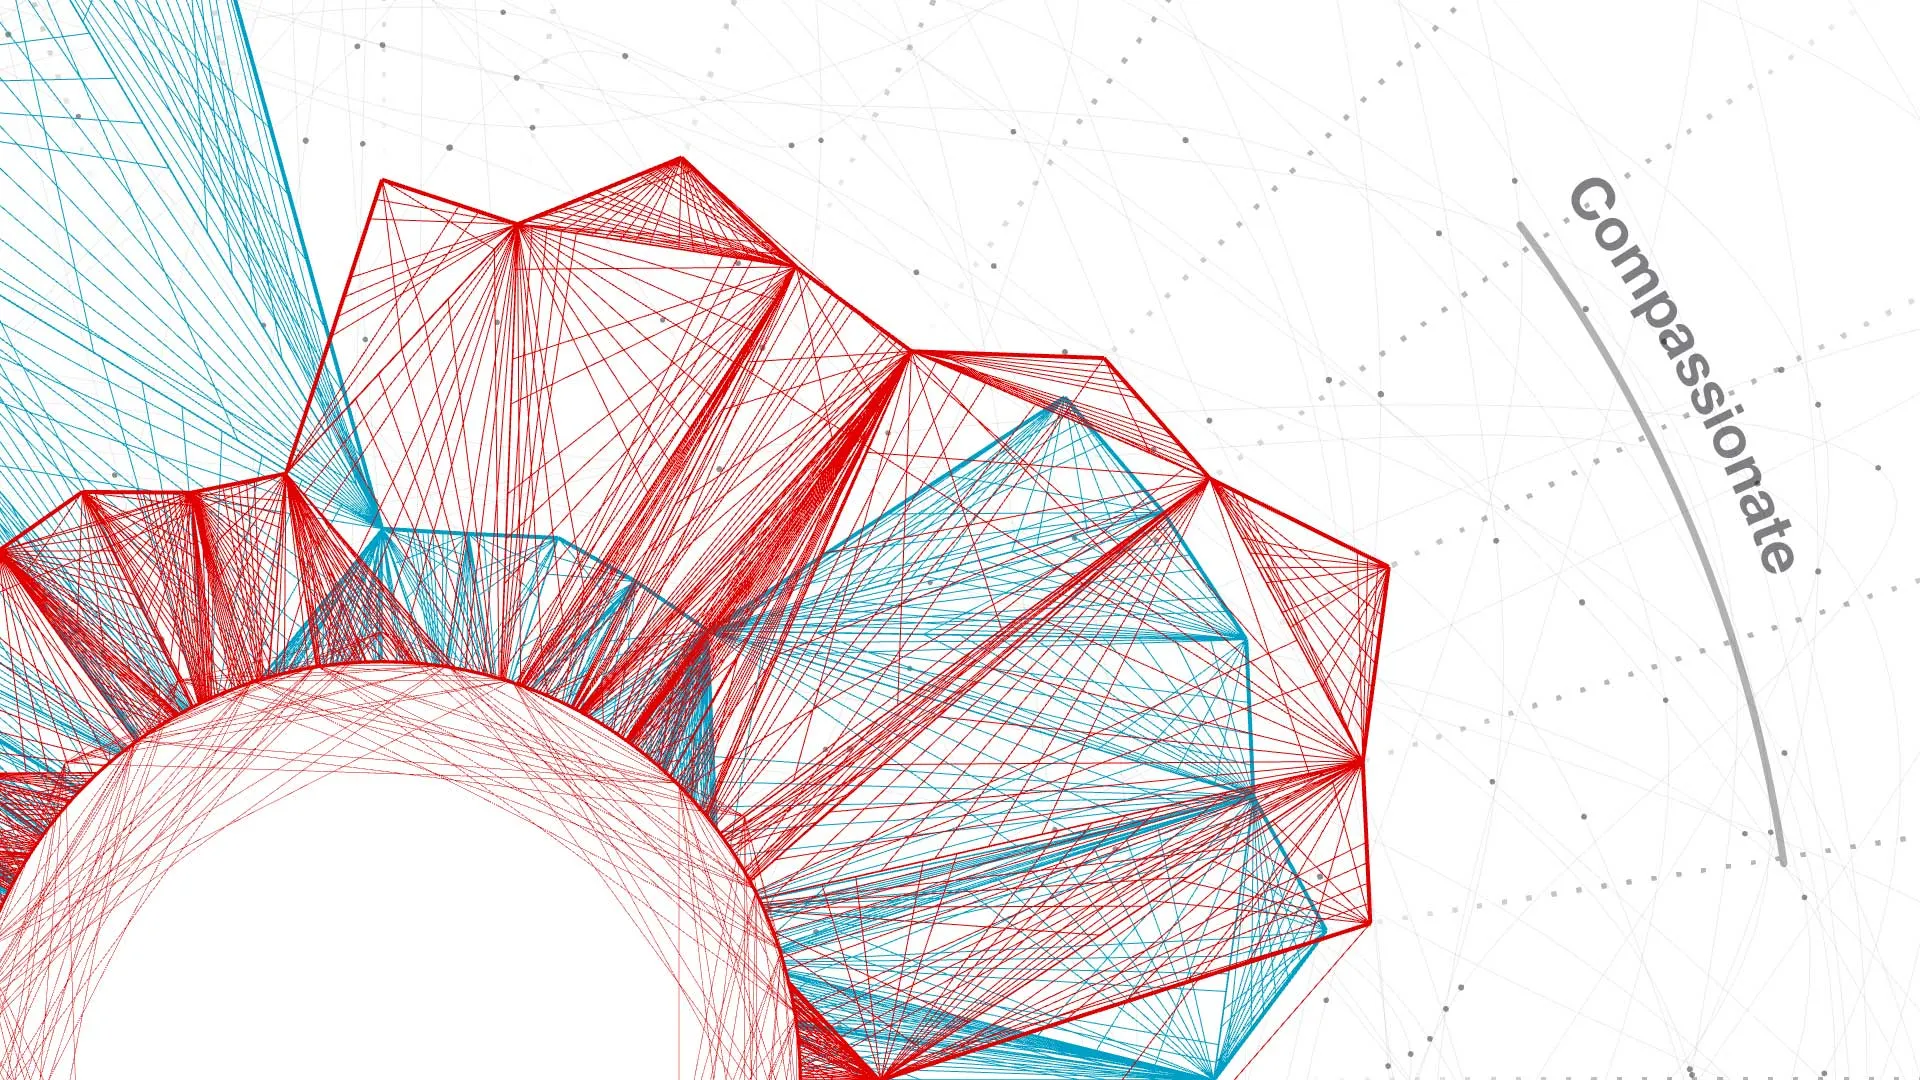
Design Your Truth - red and blue radial line graph plotting a participant's emotional scores, with 'Compassionate' labelled on the outer axis

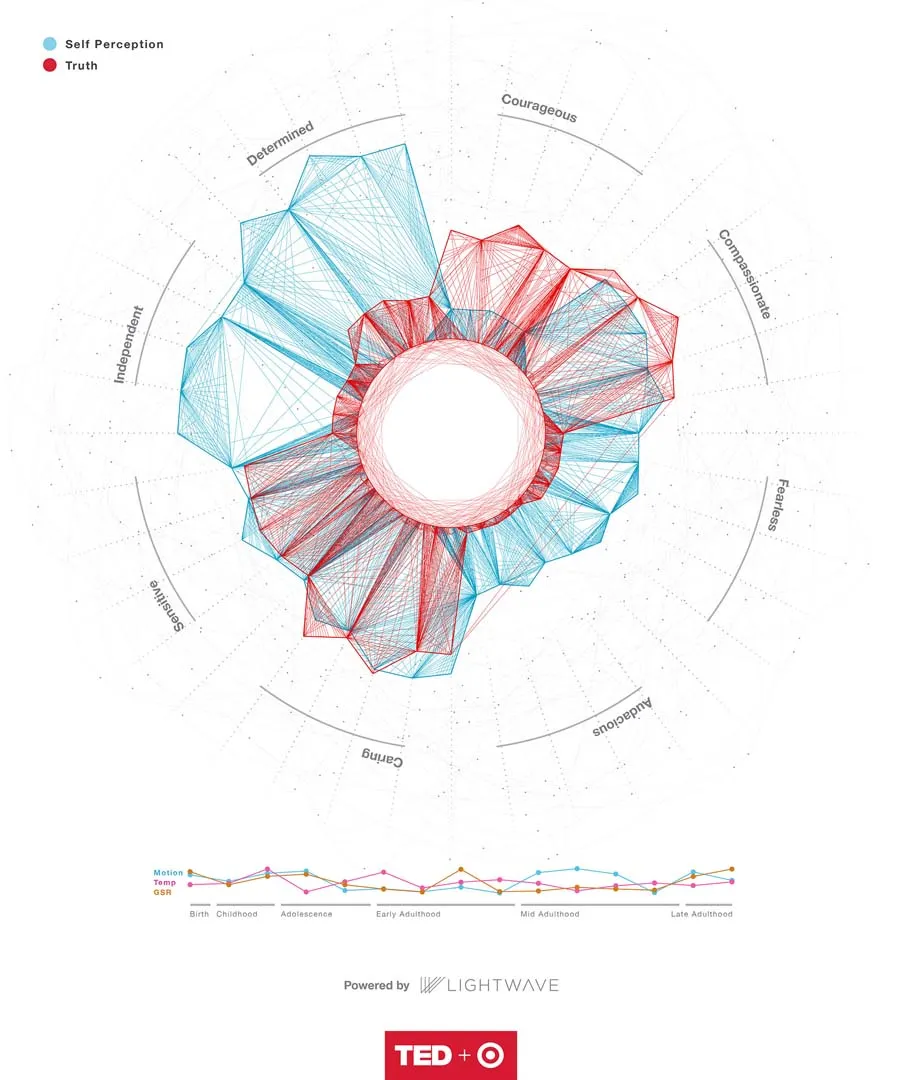
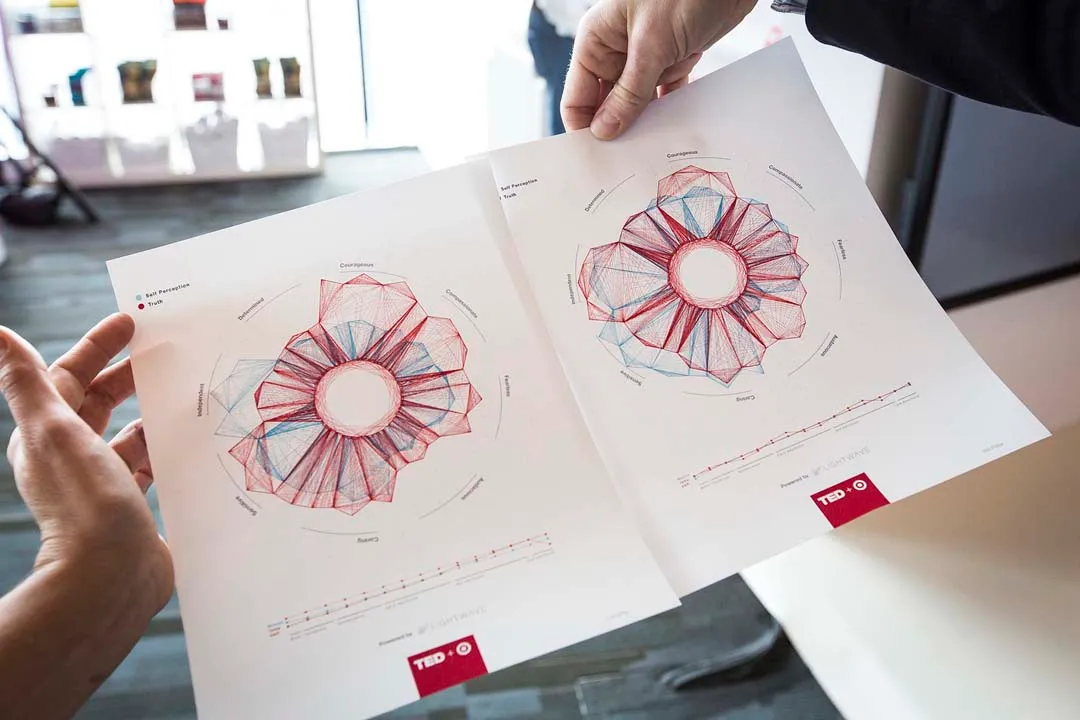
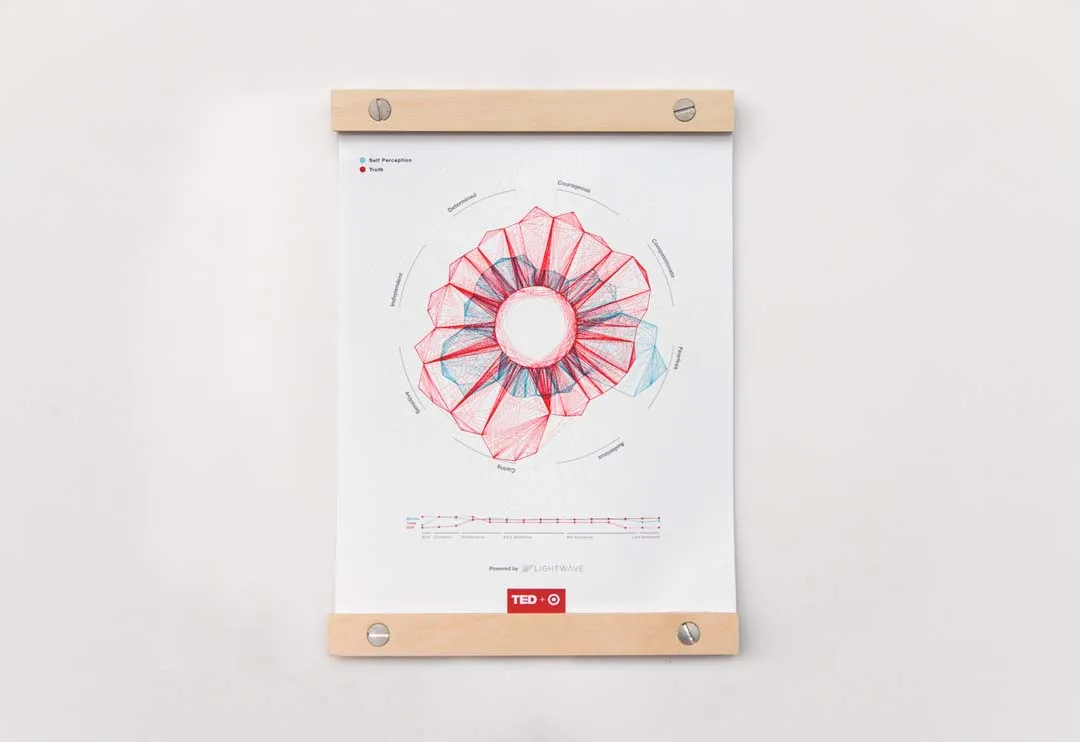
Design Your Truth is an interactive installation exhibited at TED. EyeJack designed and built the data visualisation component which mapped out how participants responded to watching an emotive short film. The data visualisation showed how they scored in 8 emotional categories and contrasted the result with their perceived response, revealing a deeper truth.
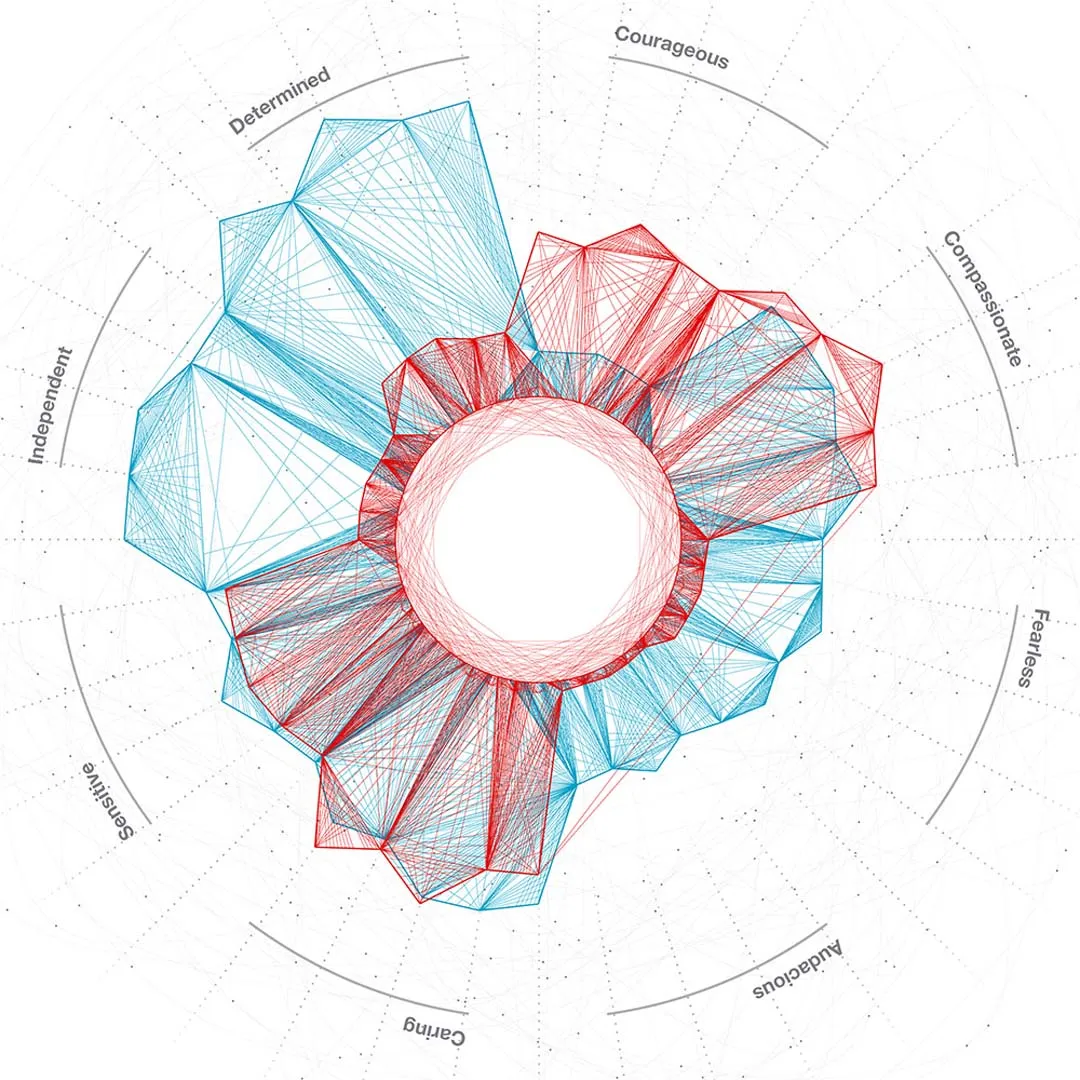

TED Design Your Truth data visualisation
TED Design Your Truth installation
Design Your Truth - three curved red and white booths at TED, screens reading ‘Design your truth’ above headphones, a visitor standing at the right booth
Design Your Truth - two TED visitors seen from behind holding a tablet with a radial emotion graph, before a wall of overlapping red and blue plot shapes
TED Design Your Truth portrait
TED Design Your Truth output
TED Design Your Truth installation view