Ecologic

100 years of Australian weather
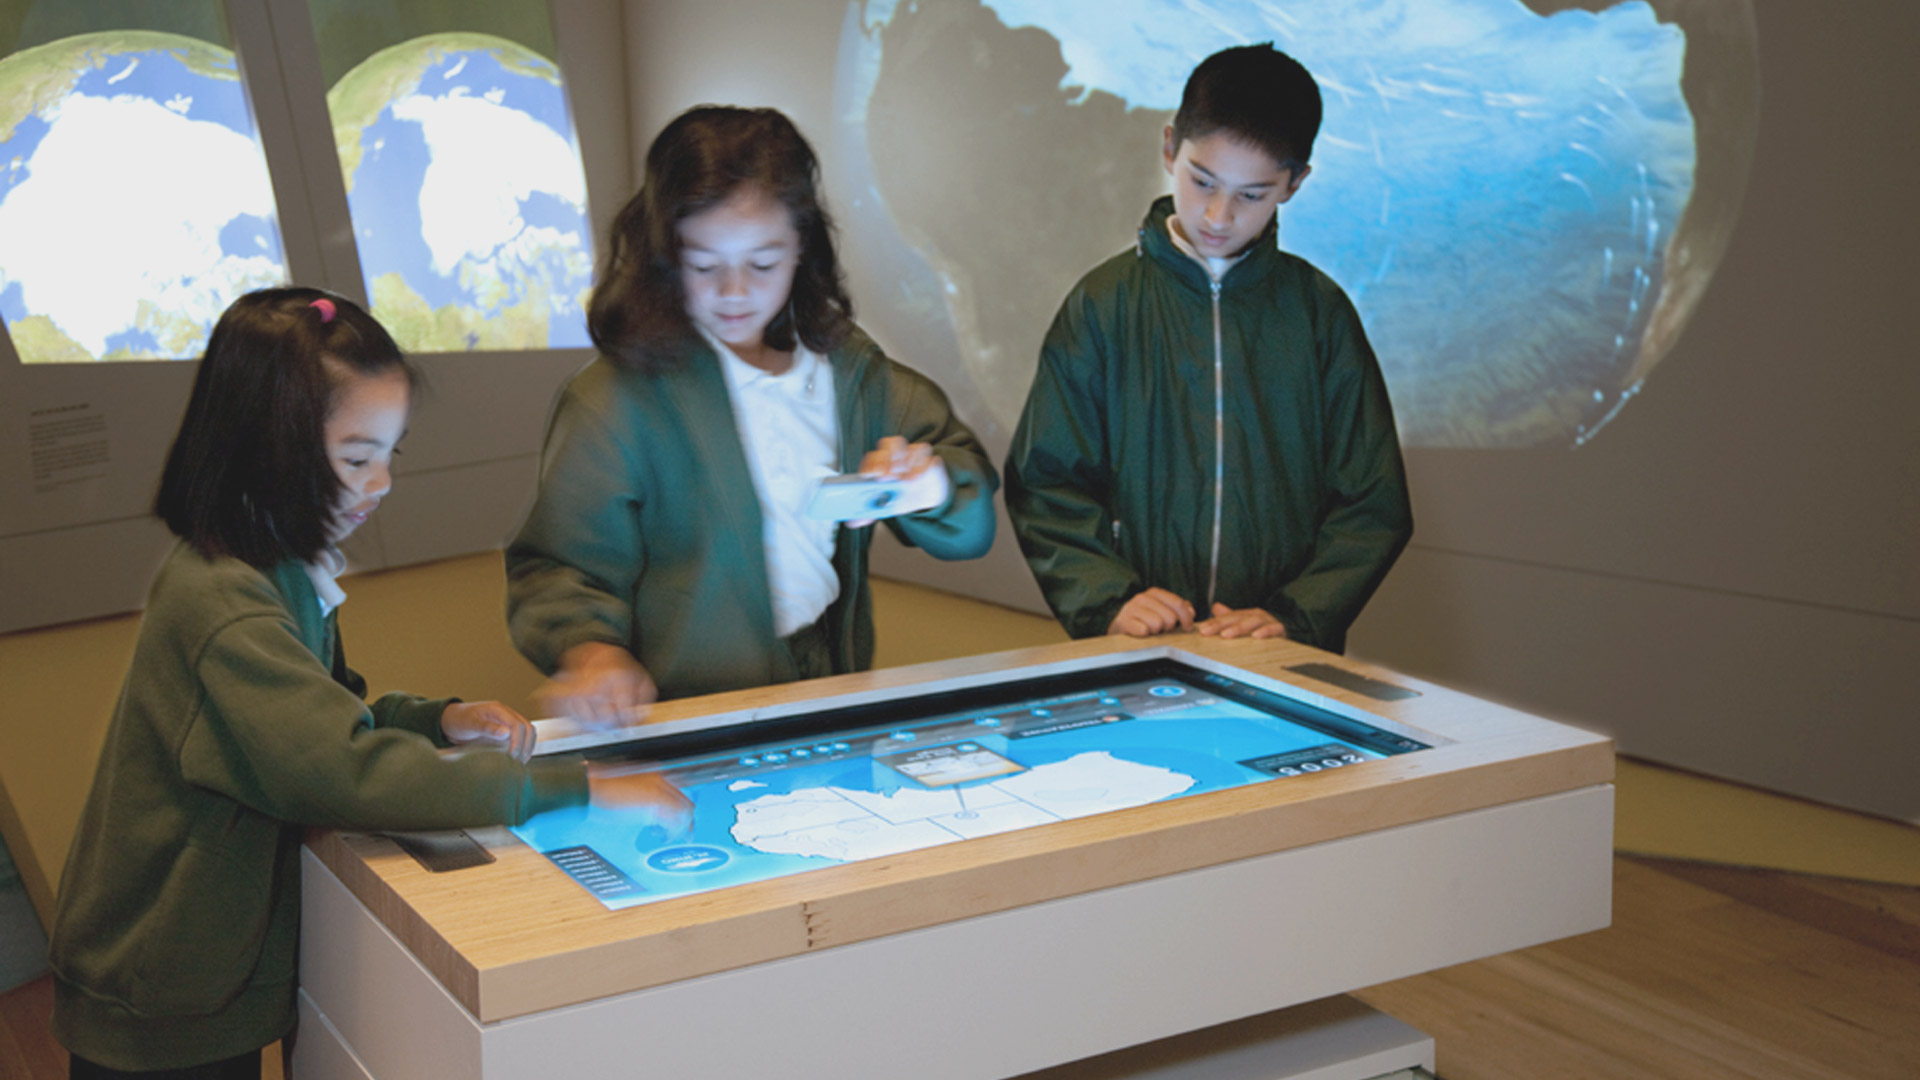
Ecologic - schoolchildren gathered around the interactive weather table at the Powerhouse Museum, projected globes lighting the wall behind

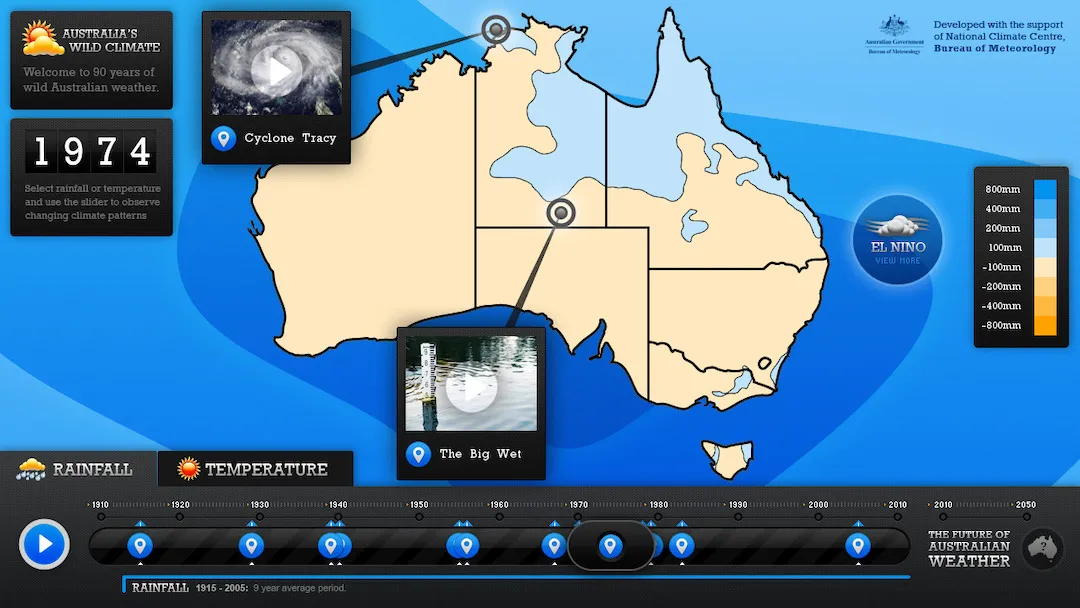
Ecologic exhibition at the Powerhouse Museum is a look at the science behind climate change. EyeJack designed and developed a interactive weather map that allows participants to explore the last 100 years of the Australian climate, visualising the change in temperature, rainfall, La Niña / El Niño, and showing when and where extreme climatic events have occurred.
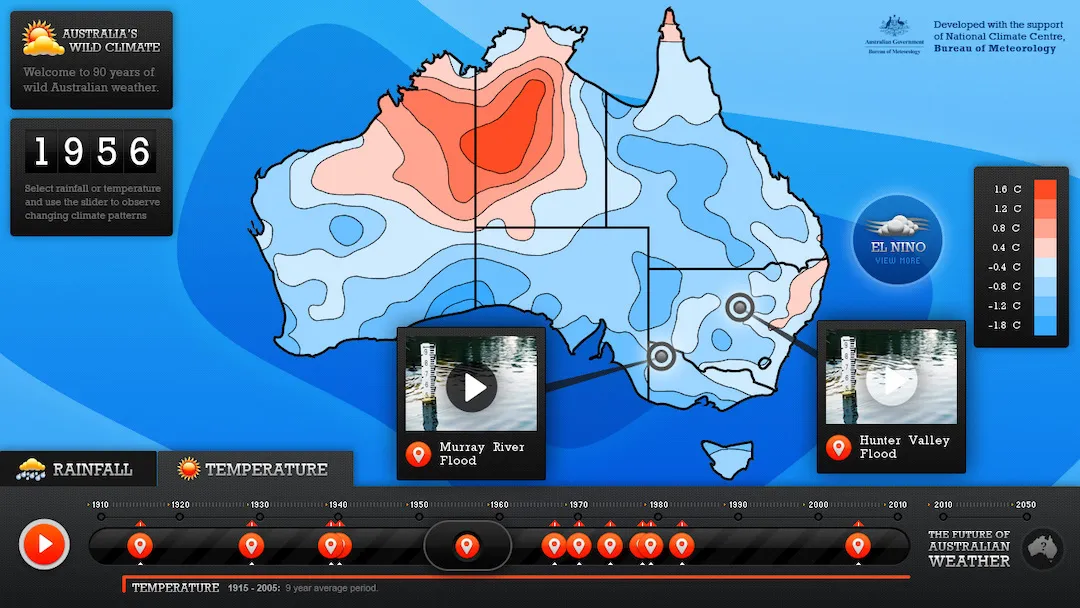
Ecologic - temperature view of the weather map set to 1956, red anomalies over central Australia with Murray River flood footage pinned
Ecologic - rainfall view of the weather map set to 1974, with archive video markers for Cyclone Tracy and The Big Wet
Ecologic - close-up of the rainfall contour bands, smooth blue to magenta gradients mapping wetter and drier regions
Ecologic - close-up of the temperature contour bands, red warm anomalies giving way to cooler blues across the map